
Rough Road for Met Coal
Drummond Co., an Alabama met coal producer, is the most recent producer to cut jobs and production as market prices have plummeted. This follows in the footsteps of cuts by fellow major met producers such as Alpha Natural Resources (ANR), Arch Coal (ACI), and Walter Energy (WLT). In a recent report, Macquarie Securities (Australia) Ltd outlined the reasoning behind the difficult year faced by U.S. met coal producers, “As the met coal party fizzled with spot prices close to one-third of the peak level seen in 2011, the Australian hosts are increasingly seeing their U.S. peers as unwanted guests in their Pacific Basin home.” In other words, Australian producers plan to keep contract price levels at low levels until 10-15 million tonnes of U.S. production are removed from the market – and it appears to be working.

(click to enlarge)
As you can see in the above graph put out by Platts, met coal prices have, for the most part, been heading in one direction for the past two years. The reported Q3 benchmark price hits a new low at $145/tonne. The only good news is that Macquarie predicts that we’ve hit bottom as its 2014 average benchmark price forecast remained stable at $179/tonne. However, in the meantime, expect a difficult 2013 for the aforementioned U.S. met coal producers.
The Future of U.S. Coal Exports
The Opportunity
Various numbers are thrown around in regards to increasing Asian demand for coal. Recently, the World Resource Institute forecasted demand growth in India of an additional 250-350 million metric tons by 2020 as the number of coal-fired power plants is set to expand by an additional 520GW. McKinsey & Co forecasts Chinese demand to increase from 500 million to 1 billion additional metric tons of demand by 2030. Who can support this kind of demand growth? As it stands only Russia, Australia, Indonesia and the U.S. are capable of producing >100M tons for export.
The long-term future of some of the major U.S. coal producers hangs largely on the potential for exports. Certainly there will be domestic demand but for investors looking for the potential to buy into a growth story, exports have the ability to provide solid future returns. Two major caveats exist. Firstly, any investment would be mid to long-term in duration in an industry which has seen substantial volatility in recent years. Secondly, this would be a high-risk, high-reward investment as badly needed West Coast terminals may not be allowed to move forward – severely restricting any growth in U.S. exports to Asia.
Current State
Currently, exports impact the various Basins in the following ways:
- Appalachia: Exports of Met and Thermal coal through the East Coast and Gulf Coast terminals. Major customer base – Europe.
- ILB: Exports through the Gulf Coast terminals. Often blended with PRB coal to reduce sulfur to acceptable levels for Europe. Major customer base – Europe and Asia.
- PRB: Limited exports through Gulf Coast terminals and Western Canadian terminals. Major customer base – Asia with limited blending to Europe.
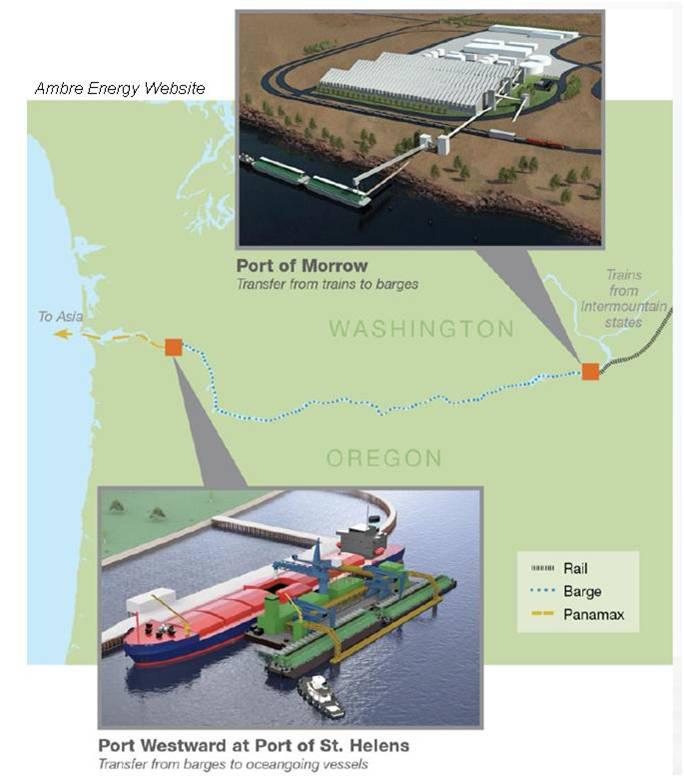
Below is a map which I put together to outline some of the major trade routes (the days listed are to a central point in Asia). Not all terminals are mapped but what should jump out is the number of coal export terminals proposed for the Pacific Northwest and the resulting reduction of days-in-transit. Currently, U.S. nameplate capacity for the East Coast is at 108mm, with estimated expansions up to 115mm. Similarly, Gulf Coast terminal nameplate capacity stands at 75mm with expansion plans of up to 124mm. Either of these regions alone could handle the 2013 estimated coal exports of between 90-100 million short tons. What is really needed for U.S. coal to be competitive in the Asian markets is export terminals on the West Coast that would cut shipping days from 18-22, down to 10-12.

This is no secret to anyone with a cursory knowledge of the coal markets (or anyone living in the Pacific Northwest, for that matter). What is of importance, however, is the likelihood of one of these terminals coming on line and which coal producers would be most impacted. There are three major terminals which have submitted permits in the Pacific Northwest: Millennium Bulk (44Mtpa), Morrow Pacific (8Mtpa), and Gateway Pacific (45Mtpa). Ambre Energy, Kinder Morgan (KMI), Arch Coal (ACI), Cloud Peak (CLD), and Peabody (BTU) would all be significantly impacted as they either own the terminal projects, have contracts to ship through them when they come to fruition, or both.
The Risk
So why aren’t we barreling ahead with one of these projects? The problem doesn’t lie in the economics – a Northwest terminal would create jobs and prove profitable to the coal producers, export terminals, and railroads; the issue lies in the communities through which the trains and terminals would operate.
An estimated 30+ trains would be passing through on a daily basis. With this comes a great deal of concern over noise and potential environmental impacts. This is a hotly debated topic and is sure to raise some strongly worded comments; however, my purpose is to evaluate the potential for new export terminals – not debate the merits or impacts of these projects.
As a bellwether, the Morrow Pacific project is the nearest-term project and will set the tone for all future projects. As a background, of all the proposed projects the Morrow Pacific project (also referred to as the Coyote Island Terminal) is the smallest and would have the least amount of impact on the communities of the Pacific Northwest. Coal from the PRB would be shipped to a warehouse in the Port of Morrow, from which it would be loaded in covered barges and shipped to the Port of St. Helens.
Ambre Energy is sticking to a timeline that calls for 3.5 million tons to be shipped in 2014 as part of their first phase, with a ramp up to the full 8 million tons thereafter. However, opponents of the export terminals have been adept at using bureaucratic procedure to their benefit to delay the project – costing Ambre valuable time and money. Most recently, Ambre’s submission for a draft air permit (submitted in August, 2012) has been stuck in review by Oregon’s Department of Environmental Quality. Initially, Ambre was told that no permit would be needed but, as it stands, construction cannot begin until the permit is issued. Once the draft is approved it will take an additional 30 days for public review.
This particular issue with the Morrow Pacific project follows a series of such delays. Prior to the air permit issue, Ambre voiced frustration over delays for a removal/fill permit from Oregon’s Department of State Lands. These delays and the vigor with which opposition groups have challenged the project do not presage well for future projects and put any semblance of a realistic timeline in doubt.
Conclusion
For the patient investor, I believe this presents an opportunity. It’s not without it’s risks and the payoff will not be immediate. One may ask – is this the best use of capital? That question depends largely on your personal investment goals and timeline. However, the opportunity exists to invest in companies which took a battering in 2012 and have begun to recover. I believe that they will continue to recover in 2013 and that any potential upside from exports through the Pacific Northwest would be a long-term boon. And this upside has the potential to be significant. If the Morrow Pacific project moves forward, followed by one of the larger projects, U.S. exports would increase 50% from 2013 forecasts. Either way, in 5-7 years the U.S. coal industry will be different than it is today. In my opinion, exports through the Pacific Northwest will be a part of that future and the time to invest in it is now.
The Ring of Fire: A Potential Game Changer For Cliffs & North American Mining
What is the Ring of Fire? “The Ring of Fire is one of the most promising mineral development opportunities in Ontario in almost a century. Located in Ontario’s Far North, current estimates suggest the multi-generational potential of chromite production, as well as significant production of nickel, copper and platinum.” The italicized material is quoted from the Ring of Fire Secretariat of the Government of Ontario, Ministry of Mines and Northern Development.
Where exactly is the Ring of Fire? The Ring of Fire is located in the James Bay Lowlands of Northern Ontario, Canada just south of Hudson’s Bay. The James Bay Lowland Region of Ontario may be politely described as a subarctic, mosquito infested swamp in summer and a frozen wilderness in winter. Descriptions used by geologists and mineral exploration personnel who have worked in the region would be, undoubtedly, censored by the Seeking Alpha editors. Conditions are bad and exploration and mineral development is and will remain very expensive; at least until massive investments are made for infrastructure. Even then, mining operations will be high cost relative to mines located further south. The Ring of Fire is located approximately 350 km due north of any all-weather roads, power grid or rail service.

How and when was the Ring of Fire discovered? The Ring of Fire was discovered as a result of De Beers’ diamond exploration efforts in Ontario beginning in the 1960’s which resulted in the discovery and development of the Victor diamond mine by the early 2000s. Actual construction of the Victor Mine began in 2007. In the course of De Beers’ regional exploration efforts, which included drilling of numerous geophysical anomalies, an exploration drill hole in 2002 discovered volcanogenic copper and zinc mineralization near McFaulds lake. However, this was of little interest to De Beers given the focus on diamonds. The VMS (Volcanogenic Massive Sulfide) was optioned to a junior company who did some drilling and stirred up a moderate degree of activity. Among the limited number of junior companies initially active in the area was Noront Resources. In 2007, Noront drilled a spectacular copper nickel PGE intercept which generated a major rush to the area and significant exploration drilling and activity. Freewest Resources, one of the active junior companies, discovered the first major Chromite ore zone (Black Thor) shortly thereafter when drilling a geophysical anomaly. Since that time, additional chromite zones have been discovered or extended by several junior companies. Cliffs, in an effort to gain entry into the Ring of Fire, acquired Freewest at a substantial premium to its market price in late 2009.
Mineral Deposits and Economic Potential of The Ring of Fire: There are numerous moderate to medium-sized mineral deposits which have come to light due to the relatively high level of exploration activity in the area since the early 2000s. A number of these known deposits are of sufficient size and grade that they would certainly be in active development if located further south with easier access to infrastructure, support and skilled labor. However given their location they are not large enough to support the requisite infrastructure. Presently known deposits include magmatic copper & nickel with PGEs; Volcanogenic Massive Sulfide copper, zinc deposits with associated gold and silver and a number of Chromite deposits not under the control of Cliffs. There are also known occurrences of vanadium and titanium that may have economic grades and tonnages with more exploration work. Regional exploration continues and competent geologists, who are familiar with the region and the current exploration programs, confidently expect additional discoveries.
The Chromite Deposits: Those already known and defined are the largest in North America and among the highest grades known in the world. It is reasonably believed that the chromite deposits of the Ring of Fire will rival those of South Africa (currently the largest and richest in the world) in size and grade. They will certainly support the development of the necessary infrastructure and are projected to be a major world source of chromite for the next century.
Lack of Infrastructure; the 500 Pound Gorilla in the Room: Depending on the exact locations and routes, the Ring of Fire district will require 350 to 450 kilometers of road and 350kw power line in addition to an equivalent length of railroad. There are two routes presently under environmental study and analysis: a generally east-west route to Pickle Lake Ontario and a north-south route to the municipality of Greenstone. Cliffs has stated a preference for the north-south route. This route will require over 100 water crossings including the Albany, Ogoki and Attawapiskat; all major rivers. Approximately 250 kilometers or so of this route would be located on solid ground and roughly 100 kilometers in the muskeg swamps of the James Bay Lowlands.
At present, Cliffs’ plans envision a gated, controlled access road with Cliffs controlling the traffic so as to maximize the efficiency of the mine’s ore, supply equipment and personnel transport. This may not be politically feasible as the affected First Nation and other stake holders are strongly advocating against exclusive control by Cliffs. Infrastructure such as power and all weather road access for the reserves is believed to be one of the major factors involved in First Nation signoff on the project. Other stakeholders who will be heard are the various other mining companies with projects that will be benefitted by the infrastructure corridor.
Political Issues: Two major political issues stand to put development of the Ring of Fire at risk: 1) First Nations concerns over development and infrastructure issues, and 2) Section 91 of the Ontario Mining Act.
First Nations, including leaders of Lake Nipigon and the Ring of Fire North/South Alliance, have been heavily involved in discussions regarding development in the region. Perhaps the most impacted First Nation; Martin Falls (whose traditional lands are where the chromite deposits are located), is wary of development, stating last year that, “The companies want to come in and exploit the resources and leave nothing behind for local long-standing benefits such as an electric grid connection and road access – both a boost to the local economy.” Recently, the Neskantaga First Nation issued a statement referring to Cliffs development plan that, “Our constitutionally protected aboriginal rights and title and treaty rights are not appropriately addressed in the amended terms of reference. Therefore, numerous fundamental issues of concern arise on the amended terms of reference as submitted”. Until these First Nations concerns are addressed, no progress will be made towards development.

On the second issue, Cliffs would like to ship concentrates or direct-shipping (DS) ore to export markets prior to building a ferrochrome plant near Sudbury. This would allow Cliffs to get the project up-and-running and returning positive cash flows before moving on the commitment to build the plant. However, Section 91 of the Ontario Mining Act states that,”… all ores or minerals raised or removed therefrom shall be treated and refined in Canada so as to yield refined metal or other product suitable for direct use in the arts without further treatment, in default whereof the Lieutenant Governor in Council may declare the lease, patent or other form of title of such lands, claims or mining rights to be void…”. To say the least, this puts Cliffs’ export plans in jeopardy. For a company with a market cap of just over $2.75 billion, any additional costs to the projected $3.3 billion development plan for the Ring of Fire is unwelcomed news. In reality, Cliffs will need to find a major partner (or partners) for the project; however, the difficulty of such a large capital commitment could make this task problematic and in such a remote area – overruns are likely.
Portfolio Mix for Exposure to the Ring of Fire: The Ring of Fire is the perfect example of a high-risk, high-reward investment. It will likely take years to come to fruition. However, if and when it does – the potential payoff is enormous. Below is a list of some of the companies (including a short description from their websites) that have exposure to the Ring of Fire and a potential portfolio mix for exposure to the region:
• Cliffs Natural Resources (CLF): Owner of the Black Thor chromium project, among others.
• McDonald Mines Exploration Ltd. (BMK.V): A mineral exploration company with established exploration experience in the James Bay Lowlands. MacDonald Mines has set upon a strategic direction of exploration with particular focus on Copper and Zinc (VMS), Nickel and Chromite in the “Ring of Fire” area of the James Bay Lowlands of Northern Ontario.
The company has 386 million fully diluted shares outstanding. They have a large land position, which can be a pro and a con. The carrying costs can be significant and the investment to conduct a full exploration will be substantial. The fact that Hudbay is involved adds some stability. Good potential as an exploration bet but, given the amount of stock already circulated coupled with the weak junior mining markets, money and future dilution could be a problem. The amount of already issued stock probably limits the upside.
• KWG Resources Ltd. (KWG.V): An exploration stage company that is participating in the discovery, delineation and development of chromite deposits in the James Bay Lowlands of Northern Ontario.
The company has 686 million shares of stock issued, which limits any upside. They own several properties with attractive drilling results. However, they are involved in some convoluted deals and joint ventures. The company owns a minority joint venture interest in the Big Daddy Chromite deposit which is substantial deposit (with the majority owned by Cliffs). The Canada Chrome subsidiary is a promotional hype of questionable value since the company probably has no exclusive surface rights to the proposed infrastructure corridor under the mining act.
• Fancamp Exploration Ltd. (FNC.V): A Canadian junior mineral exploration company with an exceptional inventory of resource projects covering more than 1,713 km2.
They own several interesting properties; however, the McFaulds Lake holdings are very early stage and could not be classified as being in the discovery stage. They have some interesting long-term prospects.
• Bold Ventures Inc. (BOL.V): A forward thinking, technology engaged team of geology experts, dedicated to breaking new ground in the field of resource exploration.
They own some promising early stage grassroots properties and have good financial backing. In addition, there are also some very reputable people on their Board of Directors and Advisory Boards. Their Kopers Lake prospect has high-grade chromite but is too deep to mine as an open pit. On the down side, they are also involved in a pretty convoluted set of joint venture agreements involving Fancamp and KWG.
• Probe Mines Ltd. (PRB.V): The McFauld’s Lake projects include Probe’s high-grade Black Creek Chromite Deposit.
The Probe Black Creek deposit has significant reserves at a good grade immediately adjacent to the Black Thor (Cliffs) deposit. It is not certain that the Black Creek deposit and the Black Thor deposit are continuous but the geophysical data strongly support that they are; if so that clearly indicates that the Black Creek reserves will be mined in conjunction with the Black Thor deposit. Probe Mines also has a very interesting, likely-economic gold deposit near Chapleau, Ontario.
• Northern Shield Resources (NRN.V): A Canadian-based mineral exploration company concentrating on platinum group element (PGE) exploration in under-explored regions of Canada.
Northern Shield’s Wabassi joint venture is not technically in the Ring of Fire but Cliffs’ preference for a north-south access/infrastructure corridor passes directly through the Wabassi joint venture claims. Wabassi is a VMS discovery which will almost certainly form a camp or district scale play with multiple VMS deposits. It is currently a 49% Northern Shield 51% Discovery Harbor (a private company) joint venture. NRN also has 100% owned claims, the Storm Group in the Wabassi area with some early stage discovery holes and the Ikertoq nickel prospect in Greenland a 50/50 JV. Since it is currently selling at seven cents per share the leverage is very good.
Below is a sample portfolio mix to gain exposure to the Ring of Fire. There is no doubt that this is a long-term investment; however, the payoff has the potential to be significant.

More Potential Trouble for the Northwest Coal Export Terminals
The governors of both Washington and Oregon sent a letter to the White House requesting that the President’s environmental council review the air-quality impacts of the proposed Northwest coal terminals. This could spell (yet another) delay for the terminals. The most likely terminal, the Port Morrow project in OR, is schedule to open by mid-2014. However, this looks increasingly unlikely as an additional environmental review was recently launched. The series of delays, which have been pushed by opponents of the terminals, aim to force the companies to abandon their plans. However, Peabody and Cloud Peak have subscribed heavily to future exports through the terminals – a good sign that the economic viability of the terminals will (eventually) force the issue.
The Future of Iron Ore
Last week I wrote an article, which focused on Cliffs’ North American operations, that generated a great deal of discussion regarding the future of iron ore. I thought I would follow up with a more general discussion of global iron ore supply/demand.
It’s impossible to discuss one particular region in regards to iron ore without discussing the future of Chinese demand and Australian supply. Coincidently, China’s National Development & Reform Commission (NDRC) recently released their forecasts for domestic demand, production and imports.
China’s iron ore consumption increased in 2012 to, yet another, record level – 743 million tonnes. That’s over 30 years of record consumption levels. This is, of course, good news for iron ore producers such as Vale (VALE), Rio Tinto (RIO), Cliffs (CLF), Fortescue Metals Group (FMG), and BHP Billiton (BHP). However, the NDRC also announced that domestic production should increase by 20 million tons in 2013 and that the above major producers will add another 100 million tonnes of production. This, in and of itself, may not be too much cause for concern. However, the agency also forecasts up to 300 million tonnes of supply coming on line in the next two years. This rate of supply growth far surpasses Chinese demand, which they forecasted would increase by 4% in 2013 (again, another record but lower than the 8% increase seen in 2012). In addition, it’s still apparent that China is making efforts to develop the efficiencies of their domestic production; which currently sits around $120/tonne on the cost curve.
I came across the below chart that was recently presented by Citi (built from company data) on future planned projects and expansions in Australia. It seems to align with what the NDRC has forecasted.

Iron ore prices are still bouncing around the $135-140/tonne price level (Tianjin, CFR 62% fines) – which is 55% higher than the 2012 low of $87.50/tonne. However, I would expect this supply/demand imbalance to start having an impact late-2013 and to begin to have a significant impact by next year.
(click to enlarge)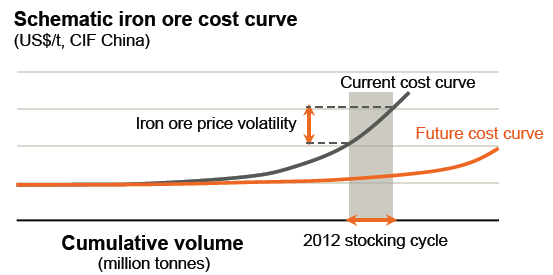
The above graph (from BHP Billiton) nicely illustrates the future of iron ore. For a period of time, Chinese demand far outpaced supply. This led to an increase in prices as higher-cost mines came on line to fulfill the need. However, as lower-cost projects will be coming on line we will begin to see the high-cost mines idled or shut down and the cost curve will adjust accordingly. In terms of investing, as I stated in my last article, for a long-term investment I would look to the low-cost producers.
Intierra Report on the Future of Gold Production
A really interesting report from Intierra (http://intierrarmg.com/Homepage.aspx) on recent trends in gold exploration projects. I’ll let them explain:
The declining rate of new gold discoveries and grades across the global market during the last decade has accelerated over the last 4 years. Over the course of the 10-year time-frame, Africa lead the way with new discoveries of 479 million ounces of gold with an average grade of 2.8 grams per tonne. Next was North America, although with significantly less new ounces of 290 million, and with a much lower grade of 1.3 grams per tonne.
Data and analysis from IntierraRMG reveals that the 2 year period from 2003 to 2004 was the best in the study range, with over 400 million ounces of new gold discovered. This includes inferred, indicated and measured ounces with an average grade of 1.65 grams per tonne. In contrast, 2005 and 2006 had the lowest number, with just over 150 million new gold ounces discovered – albeit with a similar grade.
Discoveries then increased significantly during 2007 to 2008 with greater than 390 million ounces. The average grade also increased significantly to 2.65 grams per tonne; the highest in the 10 year period.
Over the next two years, slightly more than 250 million ounces were discovered with a declining grade of 1.25 grams per tonne. This deterioration continued through 2011 and 2012 as the amount of new gold ounces discovered dipped below 225 million ounces with a reduced grade of 1.17 grams per tonne.In this 10 year study period, Africa lead the way with new discoveries of 479 million ounces of gold with an average grade of 2.8 grams per tonne. Next was North America, although with significantly less new ounces of 290 million, and with a much lower grade of 1.3 grams per tonne.
Europe had the third most new discoveries with 240 million ounces but with a higher grade than North America of 2.0 grams per tonne. South America recorded 188 million ounces, whilst Australasia saw 74 million ounces of new discoveries with an average grade of 1.4 grams per tonne.
Glen Jones, Western Hemisphere Director for IntierraRMG concluded, “With global drilling activity waning, IntierraRMG forecasts that the next few years will continue the trend with fewer new gold discoveries.”

Graph: Intierra
Met Coal Updates
The Dalian Commodity Exchange opened it’s new trading platform for Met coal futures on March, 22. It did more volume than I had expected, over 97,000 contracts with a total quantity of over 50Mmt of coal. The nice thing about these contracts is that they give us a clearer indication of, not surprisingly, future Met coal pricing. For example, the contracts for September delivery settled at $205.17/tonne.
Also in Met coal news, Walter Energy finally announced that it would idled it’s Willow Creek coal mine in British Columbia. The mine produced nearly 900,000 tons of Met coal in 2012 but, as BB&T analyst Mark Levin recently noted, the mine was operating at a significant loss.
Peabody & Arch to Hold Annual Meetings in Wyoming
I may be reading too much into this but it’s interesting that both companies chose to shift focus to their PRB assets. For Peabody it may simply be a case of trying to avoid Union protesters but Arch doesn’t really have that problem. Perhaps it’s to signal a shift in priorities?
Cliffs Natural Resources & The Future Of U.S. Iron Ore
As you can see in the below chart and are no doubt aware, Cliffs Natural Resources’ (CLF) share price has gone through a wild ride the last couple of years. This has been the case with nearly every iron ore miner with large assets in the U.S. Iron Range. The reason is simple, U.S. iron deposits are too expensive to compete in the global market.
(click to enlarge)

Take a look at the below global iron ore cost curve. I maintain a list of all iron ore mines in which I analyze their total cash costs of production per dry metric ton. These may not be 100% correct but they’re in the ballpark. I’ve highlighted in red all of Cliffs’ North American iron ore operations and ID’ed the primary country areas of the curve (although those parts of the curve are not exclusive to those countries). With iron ore hitting a two-and-a-half month low last week at $132.90 – Cliffs’ U.S. mines are dangerously close to being unprofitable. We saw what happened in Q4 of 2012 when the prices had dipped below $90/Mt; the stock price plummeted and the dividend was slashed.
(click to enlarge)

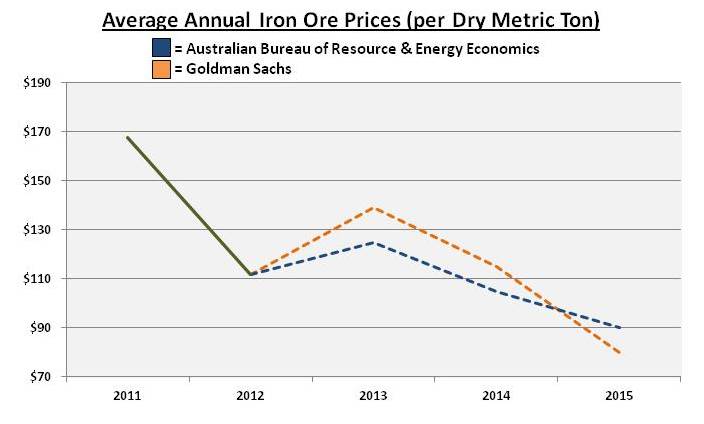
Now consider some of the recent forecasts for iron ore that we’ve been seeing. Goldman Sachs recently updated their iron ore price forecast to an average of $139/tonne in 2013 (down from a previous estimate of $144), $115/tonne in 2014, and then falling all the way to $80/tonne in 2015. The Australian Bureau of Resource & Energy Economics also recently updated their forecast, dropping the 2015 average to $90/tonne. The primary driver behind these forecasts are the sheer number of iron ore projects and expansions expected to begin production in the next year or two. At those kinds of prices, all U.S. mines will find it difficult to compete. This includes operations owned by U.S. Steel (X) and ArcelorMittal (MT); although Cliffs is, by far, the most exposed.
(click to enlarge)
There are numerous strategies to profit or hedge against this kind of risk but if you’re looking for a long-term iron ore play, consider the lower cost miners such as BHP Billiton (BHP), Rio Tinto (RIO), or Vale (VALE). I plan to complete a full analysis of the North American iron ore market next month (will be available on my blog, click the sidebar or this link: https://commoditymarketintel.wordpress.com/ ) But the fundamentals are simple, a company can’t be profitable if the price is lower than the cost of production. Of course, this doesn’t take into account Cliffs other assets – but it’s enough to keep me away.
Q2 Met Coal Price Benchmark
It was announced today the BHP settled their Q2 met coal benchmark price at $172/tonne. Slightly above the Q1 benchmark of $165/tonne (about a 4% increase), the price is still lower than most analysts were expecting. Nevertheless, it may be a signal that met coal has reached bottom and will continue to steadily increase.
